Teaching statistics for the future

The MOOC revolution and beyond

Brian Caffo
Department of Biostatistics, Johns Hopkins Bloomberg School of Public Health

Teaching statistics for the future

Outline of the talk

  1. Who the heck am I?
  2. A brief taxonomy and history of online educational models
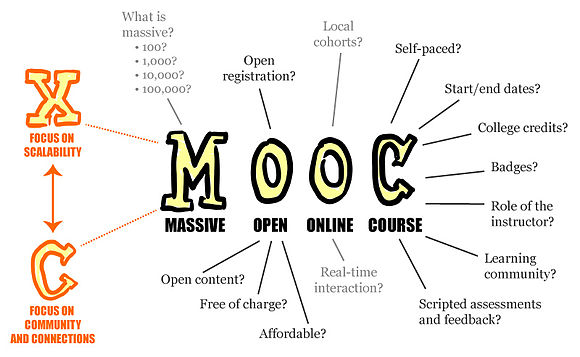
  3. Massive Open Online Courses (MOOCs)
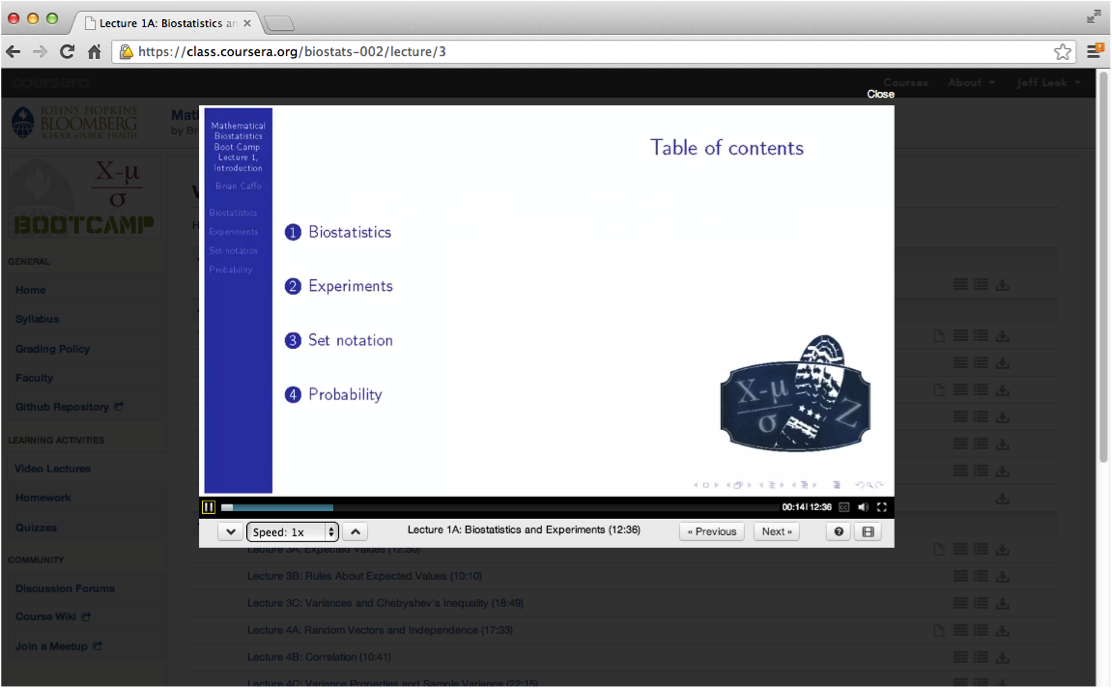
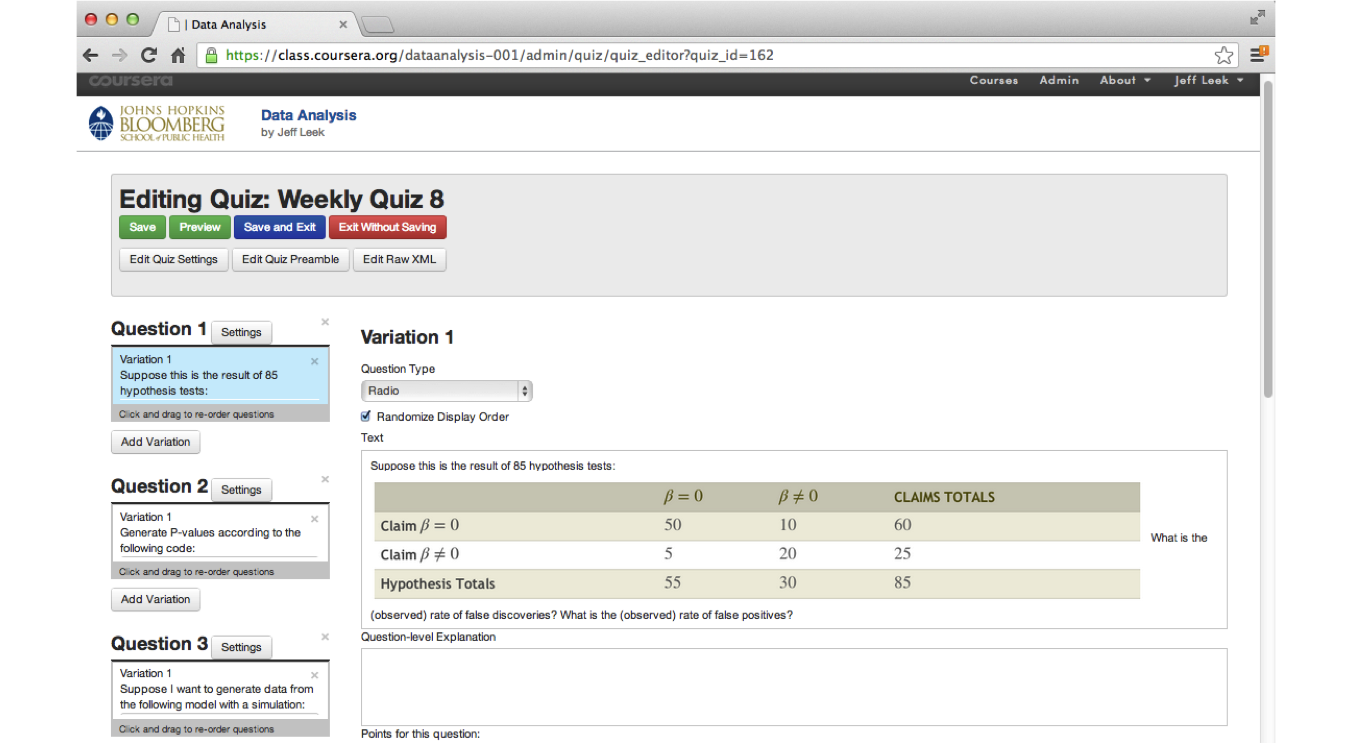
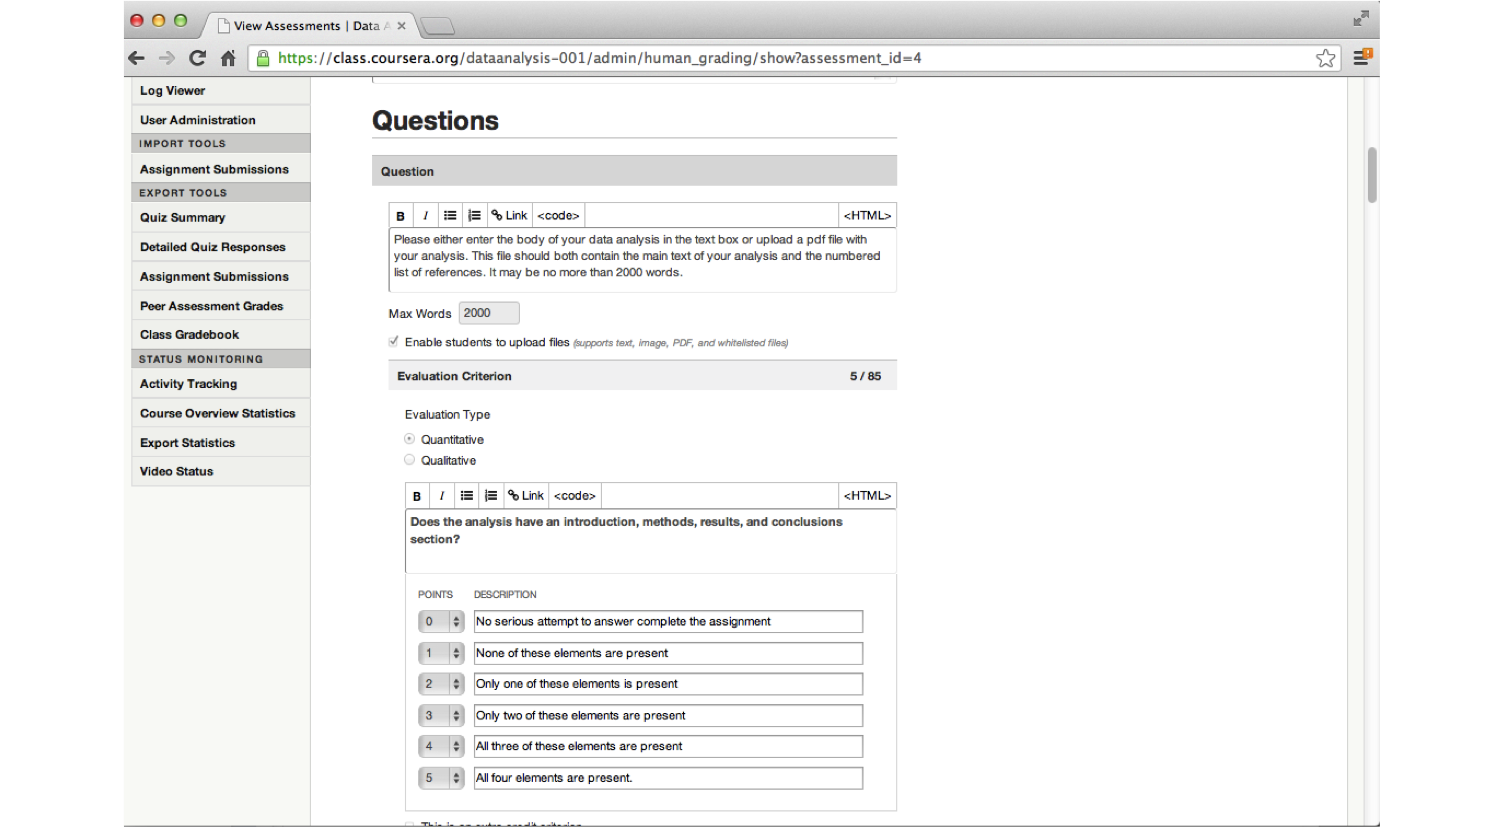
  4. JHU Biostat involvement in Coursera
  5. Novel moving target directions of the field statistics
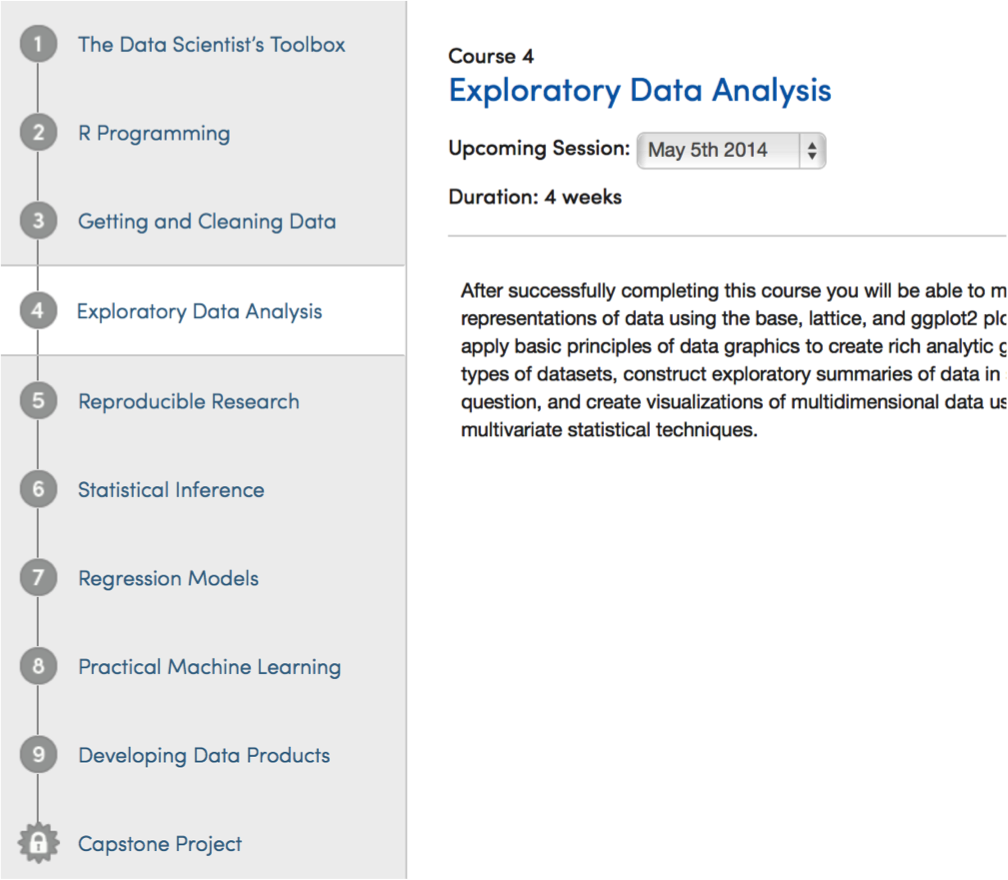
  6. Data Science series
  7. SWIRL

About these slides

Core team

Drawing Drawing Drawing

Plus generous contributions from the

My day job(s)

Connectomics

resting state fMRI

Drawing


Drawing

JHU Biostat onsite degree programs

Drawing

  1. PhD program
    • Around 50 students with around 10 matriculating per year.
    • Around 200 applications per year.
  2. ScM program
    • Around 25 students with around 10 matriculating per year.
    • Around 50 applications per year.
  3. Concurrent MHS program
    • Typically around 10 students with around 2 matriculating per year.
    • 2 - 4 applications per year
  4. Standalone MHS program

My person teaching

  • Biostat 751 and 2
    • 16 weeks (8 x 2) of classes
    • Two 80 minute lectures per week
    • Two tests per term
    • Four homeworks per term
    • One TA
  • About 10 students
  • Covers intro methods and (mostly) linear models at the doctoral level
  • Recently I've introduced the flipped classroom model

(Incomplete) characteristics of educational systems

  • Online / in person / blended
  • Active/participatory/interactive learning
  • Scalable / non-scalable
  • Low cost / high cost / freemium
  • Student paced / teacher paced
  • Open / restricted access
  • Flipped / lecture style / blended
  • Open / closed source content
  • Instructor interaction
  • Credentialing
  • Funding model

Examples

  • Traditional in person teaching generally has characterists of: in person, lecture style, non-scalable, high cost, restricted access with a large amount of instructor interaction valued credentialing
  • "Tranditional" online courses are online or blended online and in person and otherwise try to approximate traditional in person classes.
  • Online interactive learning (OIL Code School, Code academy) primary characteristics are student-paced interactive learning
  • Intelligent tutoring systems (swirl), like OILs just not necessarily online
  • Khan Academy is online, interactive, scalable and low cost
  • Other modalities : iTunes U, OpenCourseware, Udemy

MOOCs

Primary characteristics are open access, low cost, scalable, online
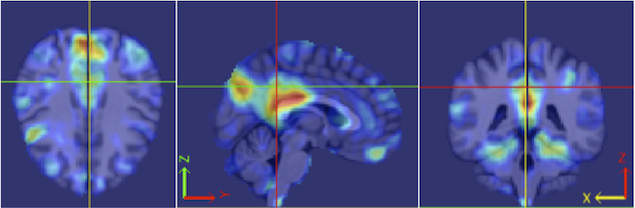
(every letter is negotiable, from Wikipedia citing Mathieu Plorde)

Drawing

Most visible MOOC instruction sites

Also

Several university/organization-specific sites, platforms and content delivery systems

  • Stanford, CMU, Duke, Harvard, MIT, google ...
  • Varying degrees of content/delivery
  • EdX platform has been open sourced
  • Google course builder (now contributing to EdX)
  • Massive amount of development going into platforms and instruction sites/portals

Coursera platform, videos

Drawing

Example videos (on YouTube)

Coursera platform, quizzes

Drawing

Coursera platform, peer grading

Drawing

Coursera platform, forums

Main source for student interaction

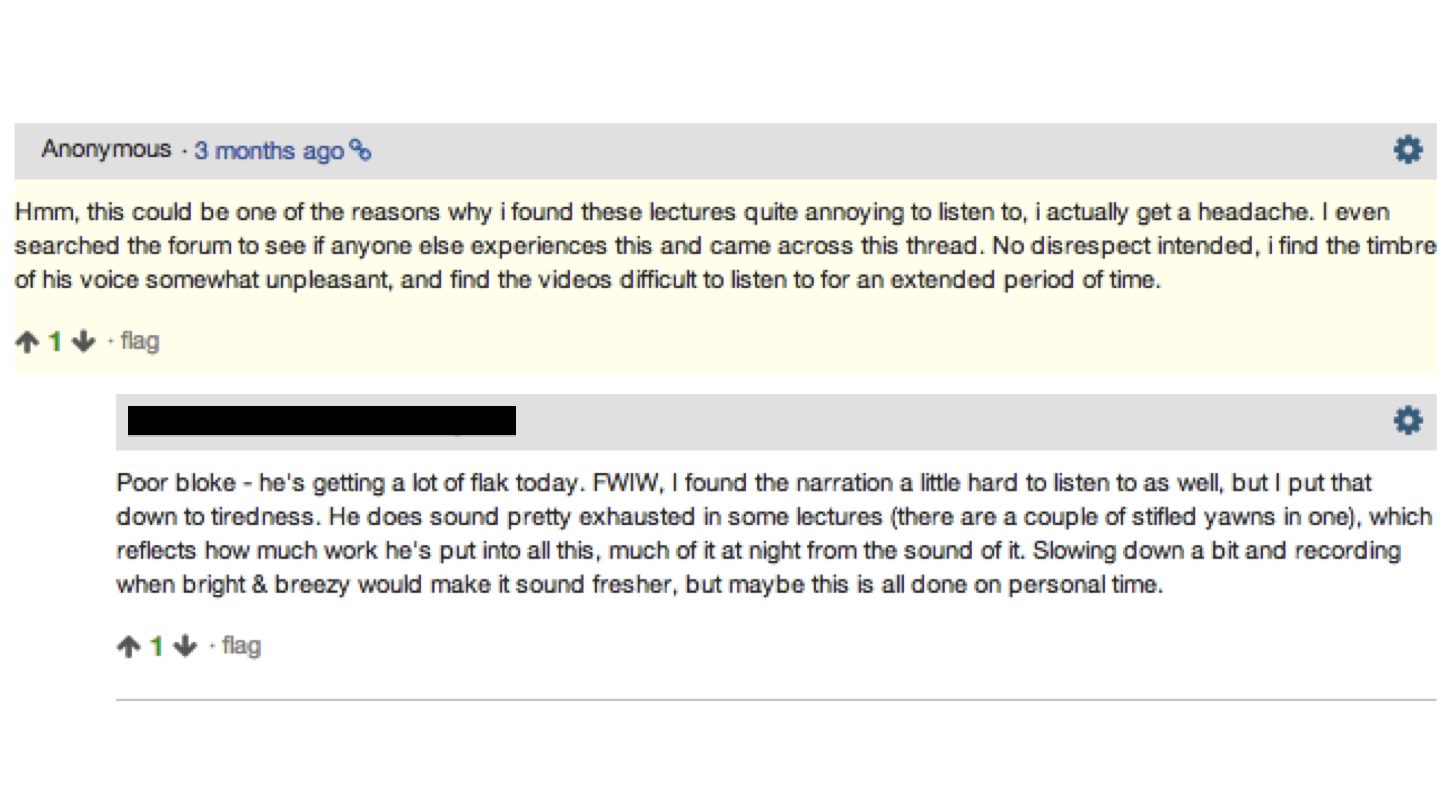
(Forums can be brutal)

Drawing

Johns Hopkins Biostat Coursera classes

Original three

  • Brian Caffo, Roger Peng, Jeff Leek
  • Run 09/2012, 09/2012, 01/2013
    Drawing Drawing Drawing

Enrollments by class and offering

Statements of accomplishment by offering

Over time, MBBC 1

Over time CDA

Important consideration about completion rates

  • Students participate in MOOCs for a variety of reasons
  • Numerous students sign up for a course, but do not actively participate
  • Current (ongoing) MBBC 1
    • 1% of enrolled students have taken any quiz whatsoever
    • 25% of enrolled students have watched any video content

Some summary statistics

  • Classes considered are MBBC1, MBBC2, CDA, DA, Case
  • A total of 549,542 students enrolled
  • 13 class offerings

    • Average of 42,272 students per class.
  • Minimum class size of 6,742 for class MBBC2 offering 2

  • Maximum class size of 101,747 for class DA offering 1.

Signature track

Drawing Drawing
  • Verification based on typing patterns (highly unique according to Coursera)
    • Secondary verification via webcams
  • Coursera gives student aid
  • Revenue distribution via agreement between Coursera and partner institution
  • 155 signature track for 20k students in MBBC1 V4
  • Much higher retention and completion rates for signature track

Interesting fallout from doing this

  • Jeff's class was listed as one of the top 10 most enrolled Coursera classes
    • Roger's class has since eclipsed it in cumulative enrollment
  • Brian and Roger have run signature track ($49 per student)
  • Brian's class featured on the front page of the Washington Post
  • Roger interviewed on Anderson Cooper and NPR
  • Scott Zeger introduced class Cased Based Introduction to Statistics
  • Brian introducted MBBC2
  • Martin Lindquist introduced Statistical Analysis of fMRI Data
  • John McGready introduced Statistical Reasoning for Public Health

MOOCs by university


Case studies

Drawing

Case studies

Drawing

Statistics, big data, data science

Drawing

Complimentary problems

Drawing

Johhs Hopkins Data Science Specialization

Codirected and taught by Roger Peng, Jeff Leek and Brian Caffo

Drawing

Courses

Drawing

Specialization certificate

Drawing

Unique aspects of the program

  • Completely redesigned stat curriculum
  • 9 signature track courses
  • 1 capstone project course
  • Total cost (modular) $490
    • $49 per sig track for 10 classes
  • Each class is four weeks
  • Quizzes, in video quizzes and peer assessment projects
  • Run monthly after initial rollout
  • All content open source

Platform choices

  • Everything done on Coursera
  • All programming in R
  • All lecture notes done in Slidify (common theme)
  • All content open source
  • Version control through git and github
  • (Students will learn and use git)
  • RStudio as an IDE
  • knitr for reproducible documents and report writing

Standard and non-standard stat content

  • Basic probability and math stat
  • Statistical inference
    • Hypothesis tests, confidence intervals, likelihood
    • Brief intro to Bayesian analysis
  • Regression and generalized linear models
  • Statistical machine learning
  • EDA
  • Data analysis
  • Reproducible research, report generation
  • Presentations
  • Interactive graphics (rgl, rCharts, shiny, manipulate)
  • Data munging, obtaining data
  • Programming
  • Plotting (ggplot2, rCharts, R base graphics)
  • Capstone project

Statistics With Interactive R Learning

In the R console

Drawing

Class selection

Drawing

Getting started

Drawing

Feedback

Drawing

Feedback

Drawing

Feedback

Drawing

Getting help

Drawing

Play mode

Drawing

Starting up again

Drawing

Skipping stuff

Drawing

Thanks!